Applies to:
- Plan -
- Deployment -
Configuration Steps
Step 1: Enable trace level metrics feature flag
Navigate to Settings > Feature flags and toggle on “Trace level metrics”.Step 2: Verify measure syntax in SQL sandbox
Test your measure query in the BTQL/SQL sandbox to confirm it returns data before adding to a chart.Step 3: Switch to custom measure input mode
In Monitor > Create chart, click the code button (</>) next to the Measure dropdown to enable custom BTQL input.

Step 4: Enter custom BTQL measure
Type your measure using BTQL syntax in the text box that replaces the dropdown.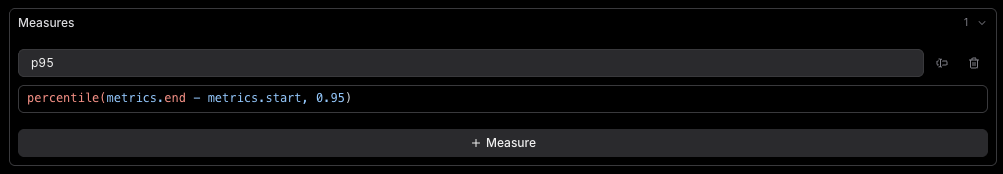
Step 5: Configure chart settings
Set Group by to your metadata field and Unit to Cost, then adjust the time range to include periods with data.Additional Notes
The default dropdown only displays scores and metrics that exist in the selected timeframe. Custom measures can reference any valid BTQL field but must use the measures statement syntax. Charts display empty if no data exists for the specified measure and timeframe. The</> code input also accepts more complex expressions that combine multiple aggregators or apply arithmetic:
- Ratio of two aggregators:
sum(metrics.tokens) / count(id) - Success rate:
1 - sum(metrics.errors) / count(id) - Cost per unique user:
sum(estimated_cost()) / count_distinct(metadata.user_id)